
Churn Prediction
Project Background
Click here to visit github repo
Understanding customer churn, which is when existing customers stop doing business with a company, is critical for the success and growth of our business. By predicting which customers are likely to churn, we can proactively take actions to retain them and improve our customer loyalty. This project will leverage machine learning and data analysis techniques to predict customer churn based on historical data and customer behavior patterns.
Data: here
As indicated by our cohort month and retention table, I observe a decreasing trend in customer retention over time. This pattern underlines the need for a churn prediction initiative. 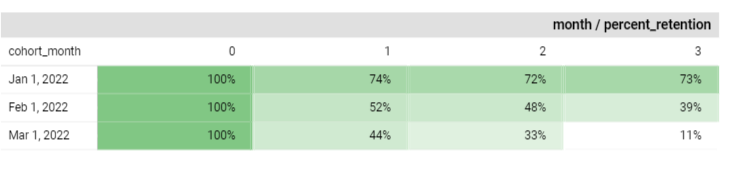
Label Definition
To understand customer behavior on churning and to define the label, I estimated each customer’s between purchase time distribution (BPD) and approximated the 90th percentile. This percentile represents a threshold beyond which a customer has only a 10% chance of making another purchase. In other words, if a customer does not make a purchase within a time frame that falls within the 90th percentile of their usual purchasing pattern, they are considered likely to churn. 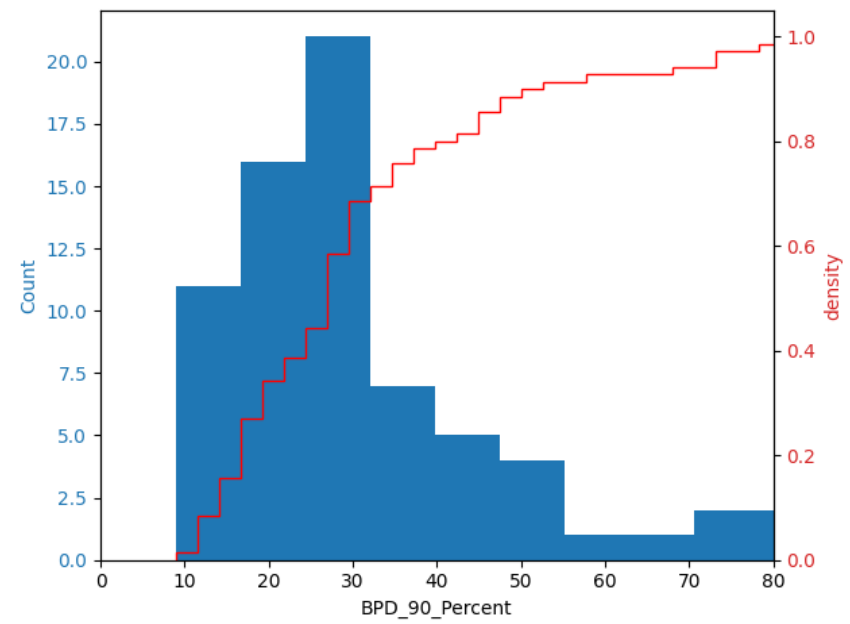 Based on data, we can take immediate actions such as sending notifications to customers who have not made a purchase after 10 days oh their last purchase, we can reach 55% of the potential churned customers, while we’re also concurrently working on developing a machine learning model to enhance our predictive capabilities.
Most of users’ BPD 90p were between 20-30 days. Churn point could be 30 days as the cumulative rate started to converge. Label = users will not transact in the next 30 days (1) else (0)
Some features used were number of trx, GMV, promo, number of product id purchased, cancelled trx, 3-month first purchase age, etc.
Metric used: F1 score as it is robust to class imbalance and assuming false positive and false negative are equally important, make f1 score the preferred choice
EDA 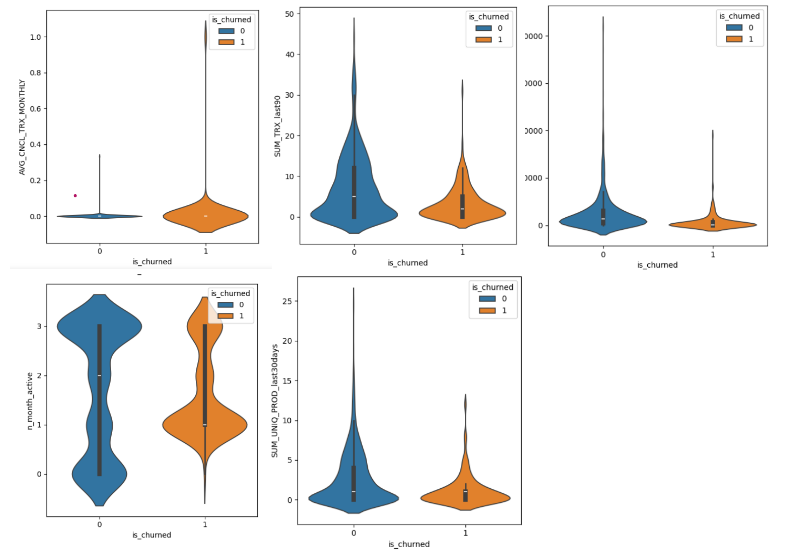
indicating that customers with
- more transaction
- lower promo to GMV ratio
- lower monthly average cancelled trx
- longer terms
- a diverse range of product purchased
are less likely to churn. While the plots provide initial insights, it’s noteworthy that they may not be the optimal approach for differentiating churn likelihood.
more details were provided here
Training-test data: Train data: jan-sep 22 Test data: oct-nov 22
Method
After the initial data cleansing process, I utilized both Logistic Regression (used as our baseline model) and Random Forest for training purposes. To further enhance the performance of our models, I implemented a refinement process using GridSearchCV.
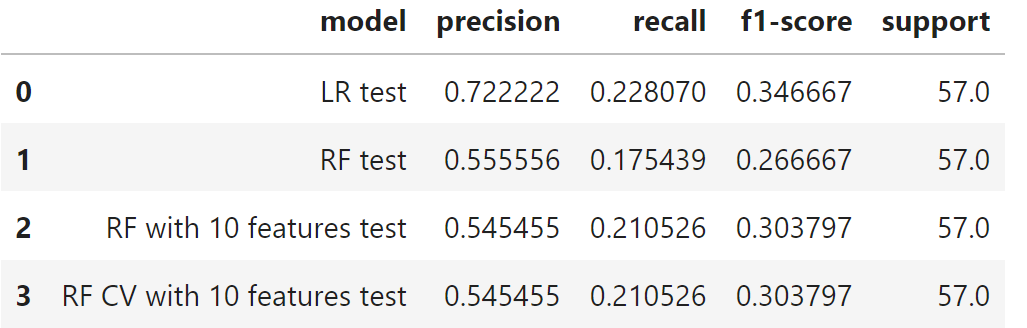
Performance metrics
I decided to go with the Random Forest model with cross-validation as our final choice as it reduced overfitting (for details, visit github). While Logistic Regression is a possible alternative, it requires dealing with multicollinearity issues and meeting other regressionn assumptions. Since this project primarily acts as a part of my portfolio, I conclude the modeling process here.
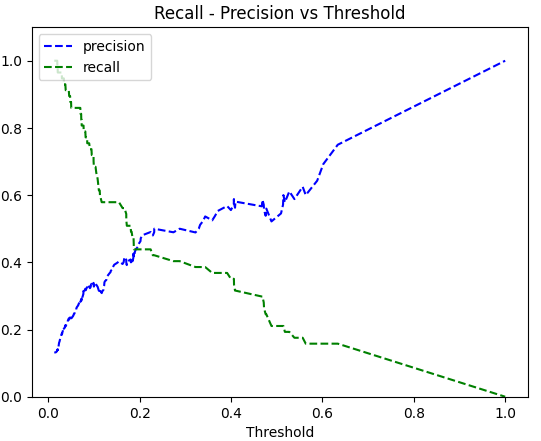
Given the recall-precision vs threshold plot, we can pick the optimum threshold, but for this project, I pick 0.5
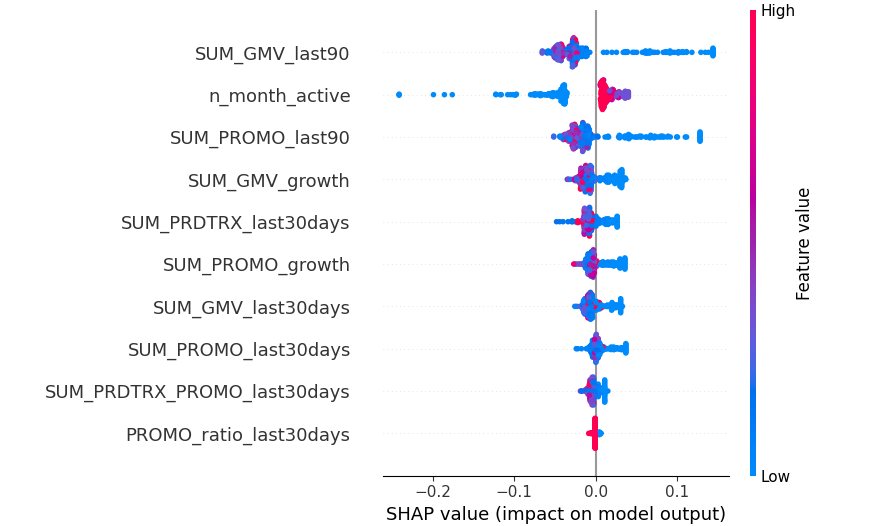
Shap can help us explain the model easier, from the given picture, it shows that lower GMV in the last 90 days, the lower n_month_active, the lower promo amount use in the last 90 days, lower gmv growth can have higher churn risk.
However, reflecting on n_month_active, it appears that our current model’s performance may not be good enough. To address this, one potential approach could involve developing separate models tailored for existing and new customers.
Inference
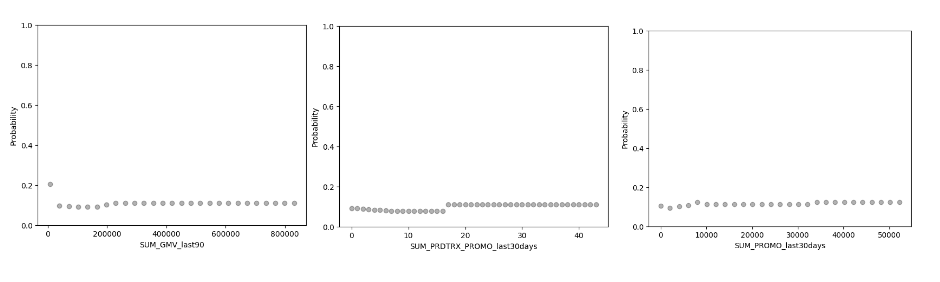
Based on the chosen model,
- if GMV in the last 90 days = 0
- number of products that bought with discount > 20
- Discount amount in the last 30 days > 10000
lead to higher churn risk
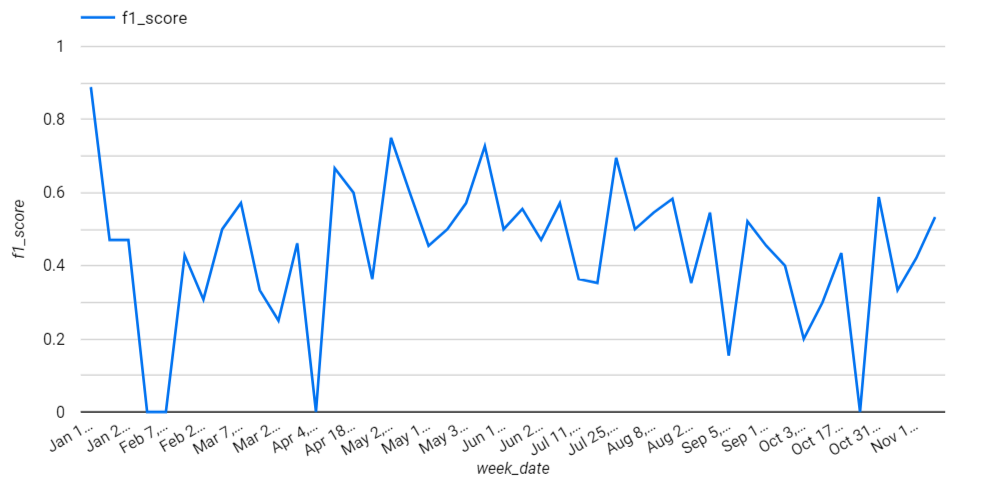
The provided graph illustrates the weekly monitoring of the F1 score, revealing fluctuations over time. In response to these fluctuations, I implemented tracking for the Population Stability Index (PSI) to assess data skewness (for more details, look at github)
When analyzing a churn prediction project, our approach depends on how we decide to act upon potential churn instances. If we opt for offering discounts, we need to estimate the costs and potential profits involved. It’s worth noting that, for my portfolio, I won’t cover this aspect.
FOR THOSE INTERESTED IN TECHNICALS
Proposed Infrastructure
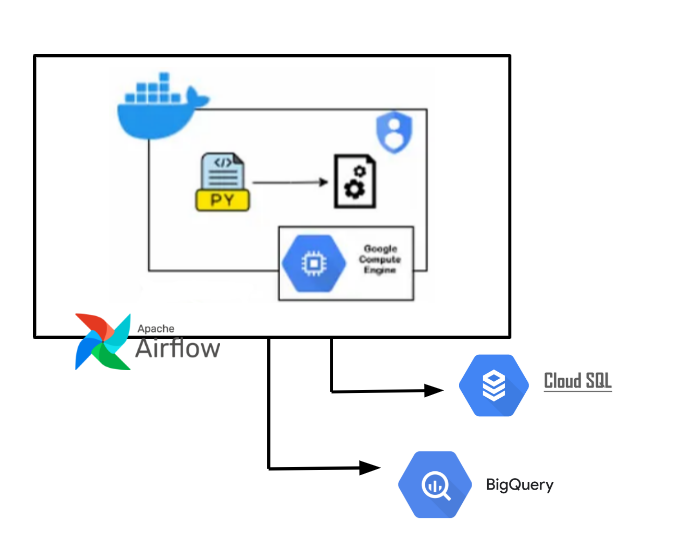
The implementation plan encompasses developing a RESTful API alongside the integration of a robust batching infrastructure. Upon deployment, the application will operate within VM and Kubernetes. For task scheduling, Airflow will orchestrate API calls. Data generated and processed within the application will be stored in BigQuery, including monitoring of both metrics and data skew.
Additionally, if necessary, to expedite data retrieval for the main application, Cloud SQL has been considered due to its superior speed and performance. While the project only focuses on constructing the REST API and establishing data storage within BigQuery, future iterations may involve leveraging Airflow for scheduling tasks or adapting scripts to accommodate storage in Cloud SQL.
Endpoint availability
- /churn_score_generation: consists of creating temp feature table, predicting churn score using existing model, store result to bq, calculate psi to monitor feature data and calculate evaluation metrics on last month prediction data
- /job_status
- /churn_prediction: get churn score by customer_id (to note: ideally for data integration to the main app, we use faster db, such as Cloud SQL, but we utilize bigquery for this portfolio)
Detailed documentation on how to use the API is included within the app’s collection file on github.
category: